Estimating the driving range of electric vehicles is a complex challenge influenced by numerous variables that affect energy consumption. To provide standardized range estimates, several driving cycle tests have been developed over the years, each with its own methodology and level of realism. This article explores and compares the most widely recognized test cycles – NEDC, EPA, and WLTP – to understand their differences, strengths, and limitations in reflecting real-world driving conditions.
EPA Driving Cycle
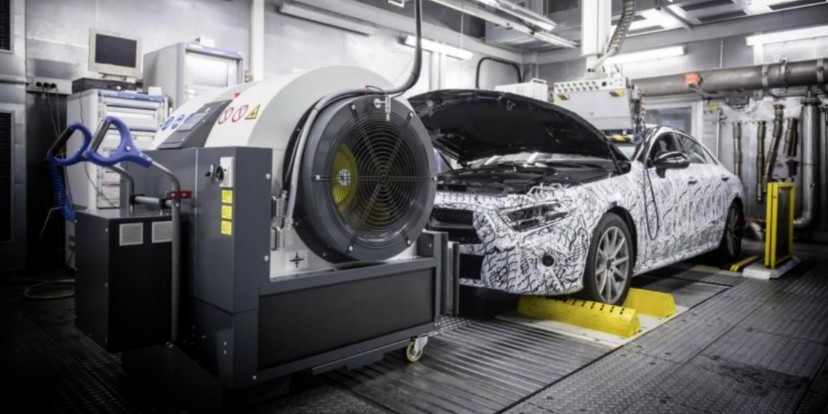
The EPA (Environmental Protection Agency) test cycle, primarily used in the United States, assesses vehicle efficiency on a dynamometer rather than on the road. It combines two sub-tests: the UDDS (Urban Dynamometer Driving Schedule) for city driving and the HWFET (Highway Fuel Economy Test) for highway driving. The testing procedure involves running continuous cycles mixing approximately 45% urban and 55% highway conditions until the battery is fully depleted.
Afterward, the vehicle is recharged via a precise measuring device that records energy drawn from the grid, factoring in onboard charger efficiency. Additionally, a correction factor is applied to simulate real-world driving, generally lowering the official range estimate. While the EPA cycle is considered strict and conservative, its consistency varies among different electric vehicle models due to manufacturer-specific interpretations. For instance, the Porsche Taycan’s official EPA range tends to underrepresent real performance, while Tesla’s Model S often cannot meet its official EPA figure due to differing testing adjustments.

NEDC Driving Cycle
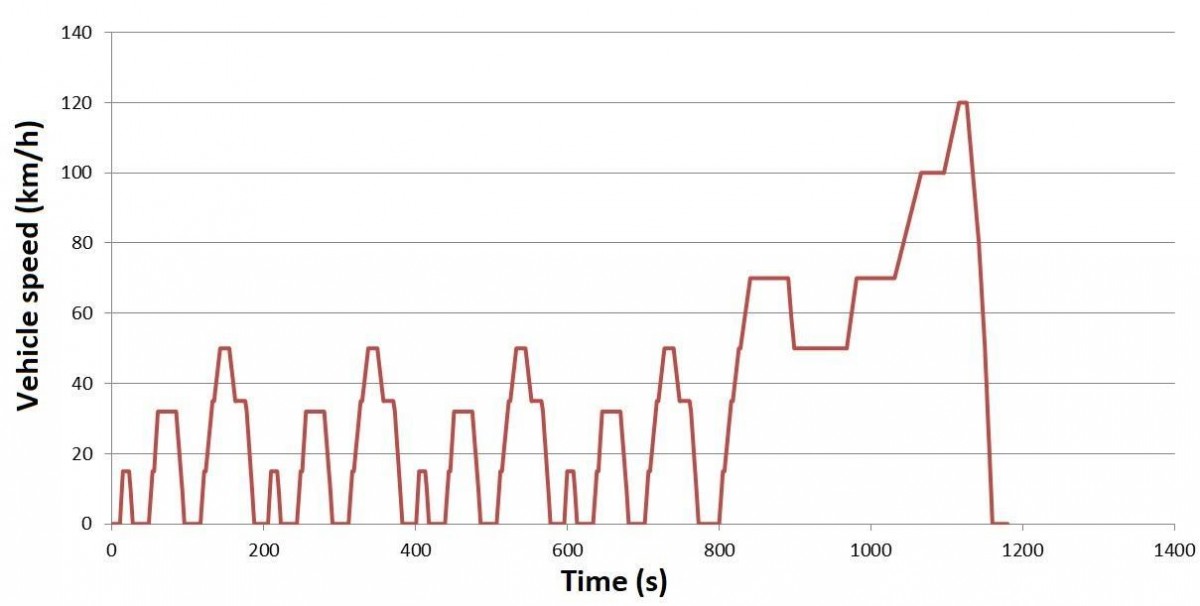
The NEDC (New European Driving Cycle) was the standard test in Europe from the 1980s until it was replaced in late 2017. This lab-based test incorporates an 11 km route with 20 minutes of driving combining two phases: 66% urban and 34% highway driving. The urban phase is represented by the ECE-R15 subcycle, and the highway phase by the EUDC subcycle.
The NEDC cycle operates under ideal conditions, excluding air conditioning and other electrical auxiliaries, and disregards optional equipment’s impact. With an average speed of only 34 km/h and a maximum speed capped at 120 km/h, this test often produces optimistic range and consumption figures that can significantly diverge from real-world experiences, leading to its phase-out in favor of the WLTP cycle.
WLTP Driving Cycle
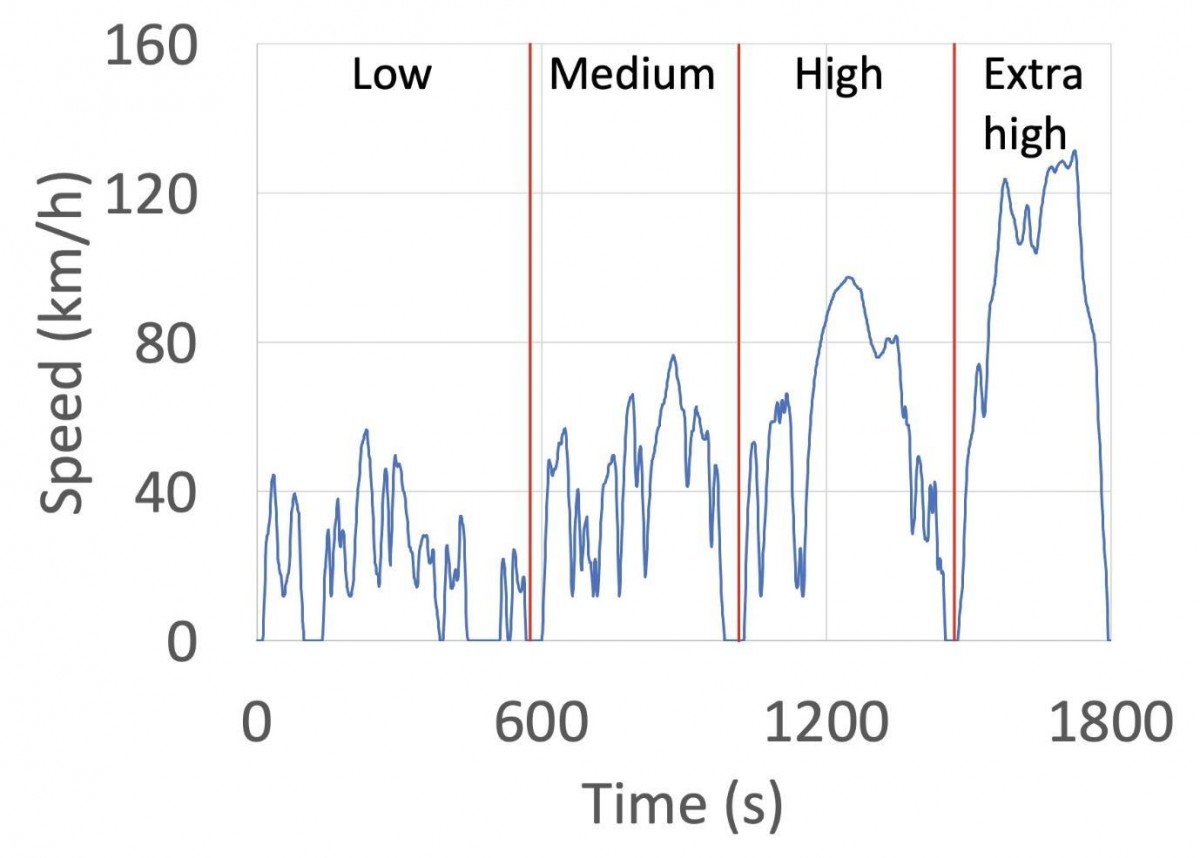
The WLTP (Worldwide Harmonized Light Vehicle Test Procedure) cycle replaced the NEDC in September 2017 across Europe and aims to be a more realistic and representative test. Conducted in a laboratory setting, it covers 23.25 km over 30 minutes with four speed phases: low, medium, high, and extra-high.
Its driving pattern includes a balanced mix of 52% urban and 48% highway stages, with an average speed of 46.5 km/h and a maximum speed of 131 km/h. Unlike its predecessor, the WLTP factors in different equipment variants and tire-wheel combinations, as these affect aerodynamics and unsprung mass, impacting energy consumption and range.
Which Cycle Provides the Most Accurate Range?
Determining the most accurate test cycle depends on many factors including driving style, terrain, and environmental conditions. While none can claim perfect real-world precision, some provide better approximations than others.
The NEDC is widely considered the least reliable for modern electric vehicles, yielding overly optimistic figures that vary greatly between models. The WLTP offers more consistent results across different brands and better reflects real-world consumption, and the EPA cycle tends to be the most conservative.
Moreover, other regional driving tests exist globally, such as China’s CLTC (similar to NEDC), India’s IDC, and Japan’s JC08 cycle, each with its own peculiarities.
Comparative Data for VW E-Golf
| Model | Cycle | Range (km) | Power Consumption (kWh/100 km) |
|---|---|---|---|
| VW E-Golf | EPA | 190 | 17.5 |
| VW E-Golf | NEDC | 300 | 13.2 |
| VW E-Golf | WLTP | 231 | 15.8 |