As the electric vehicle market heats up, discussions around peak DC charging power have proliferated. Figures like 150 kW, 200 kW, and even 300 kW feature prominently in manufacturers' marketing strategies, often leading consumers to equate these numbers with overall performance. But how significant is this peak power in the grand scheme of electric vehicle (EV) charging? Given that most EV users charge their vehicles at home or at relatively low-power stations, the relevance of ultra-fast DC charging is often overstated.
In Europe, the majority of drivers travel up to just 50 km each day, prompting the question: is ultra-fast charging capability necessary for daily usage? This article aims to dissect the importance of peak DC charging power, exploring whether these figures truly reflect real-world charging experiences or are simply marketing buzzwords.
Understanding Peak Charging Power
Peak charging power has become a focal point for EV manufacturers, particularly with advancements in 800V architecture, as seen in vehicles like the Lucid Air (300 kW) and the Porsche Taycan (270 kW). However, the peak charging power is only one metric. In the realm of 400V systems, Tesla holds the highest peak at 250 kW, while other models like the Nissan Leaf (50 kW) and Skoda Citigo (40 kW) lag significantly behind.
The table below illustrates these peak charging rates alongside the estimated driving range achieved per minute of charging at highway speeds of 130 km/h.
| Model | Peak Charging Power (kW) | Estimated Consumption at 130km/h (kWh/100km) | Range/Minute of Charging (km) |
|---|---|---|---|
| Lucid Air | 300 | 21 | 23.8 |
| Porsche Taycan | 270 | 24 | 18.8 |
| Tesla Model S | 250 | 21 | 19.8 |
| Kia EV6 | 233 | 26 | 14.9 |
| Mercedes EQS | 200 | 23 | 14.5 |
| Peugeot e-208 | 100 | 26 | 6.4 |
| Nissan Leaf e+ | 50 | 26 | 3.2 |
| VW e-up! | 40 | 23 | 2.9 |
The Charging Curve Matter
While peak DC charging power demonstrates a vehicle's technological prowess, what everyday drivers really need to know is the mean DC charging power during practical usage, particularly between 10% and 80% battery levels.
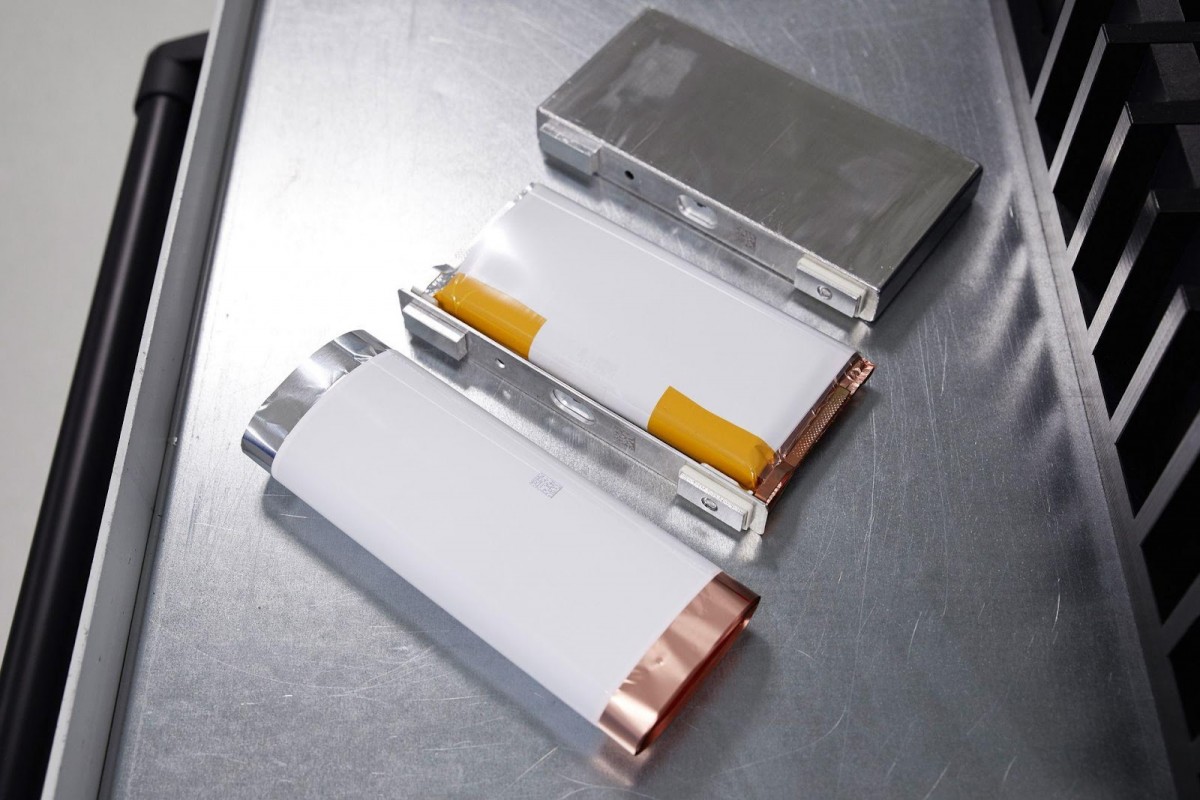
In reality, electric vehicle batteries can only sustain peak power for short periods. Charging curves vary widely among manufacturers, influenced by battery specifications and management systems designed to prevent overheating and ensure cell balance during charging levels.
The following table provides mean charging power data taken from various vehicles, shedding light on real-world performance from 10% to 80% battery capacity.
| Model | Mean Charging Power 0-80% (kW) | Estimated Consumption at 130 km/h (kWh / 100km) | Range/Minute of Charging with Mean Power (km) |
|---|---|---|---|
| Lucid Air | 175 | 21 | 13.89 |
| Porsche Taycan | 147 | 24 | 10.21 |
| Tesla Model S | 180 | 21 | 14.29 |
| Kia EV6 | 175 | 26 | 11.22 |
| Mercedes EQS | 180 | 23 | 13.04 |
| Peugeot e-208 | 65 | 26 | 4.17 |
| Nissan Leaf e+ | 43 | 26 | 2.76 |
| VW e-up! | 27 | 23 | 1.96 |
Final Thoughts
The findings suggest that while peak DC charging power appears impressive on paper, the average mean charging power hits a plateau around 180 kW during typical charging scenarios. This underscores a technological limitation inherent in today’s lithium-ion batteries.
It remains to be seen whether future innovations like Li-Air or solid-state batteries can surpass this limit. Until then, consumers should focus on mean charging capabilities when considering their electric vehicle needs.
 The Future Lies in Practical Charging Solutions